A story about a banker and his standard deviations
and the lesson it offers on Investment Risk
If you’ve not yet heard this true story of the Investment Banker and his standard deviations, read on.
This ludicrous but funny story might just help you remember one of the most important things about investment risk – and it’s this.
The model the ‘experts’ use is wrong!
Introducing the Banker
The Investment Banker in question is a guy called David Viniar who held a big job – as the Chief Financial Officer of Goldman Sachs – during the global financial crisis of 2008-09.
Viniar was not alone in claiming that the scale of the crash in markets (in 2008-09) was unpredictable. He just became famous for saying that,
“We were seeing things that were 25 standard deviation moves, several days in a row”.
Sounds very dull and technical, right?
Yes, and don’t worry, I’m not going to bore you with a load of statistical maths here (well not much anyway)… this is a plain English website remember 😉
Suffice to say, if you hear people talking about ‘standard deviations’ around investment risk, you need to be on your guard.
Why? Because that term suggests that the person you’re talking to believes in a model of risk which… well, how can I put this delicately… doesn’t reflect reality!
Eh?!
Yes and don’t take my word for this.
Mandelbrot, who is sadly no longer with us, debunked the idea that the normal distribution/standard deviation model works in stock markets… six decades ago.
The problem is that the finance industry ignored him then and ignore him to this day, despite 2008-09 and the vertical falls we’ve seen in markets in recent days.
The truth about how market prices really behave, as Mandelbrot says in that interview, just gets swept under the carpet.
Hold on – what is a standard deviation?
Sorry, should have said.
A standard deviation is a tool to help us estimate how many data points there might be, on either side of the average, depending on how far you deviate from that average.
And it works quite well when the data fits a nice neat distribution like this – which is called the ‘normal’ distribution.
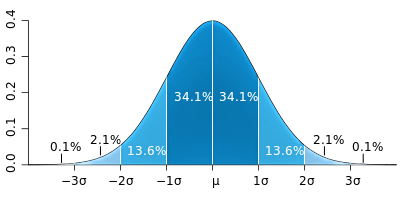 So, knowing about standard deviations is useful when dealing with data that has a meaningful ‘average’ number – like the distribution of peoples’ height or weight in a population.
That sort of data helps manufacturers design car seats and know how many pairs of each size of shoes to put into production… and so on.
All good stuff.
The trouble is that stock market price movements do not fit that nice neat normal distribution curve.
They just don’t have any meaningful average return.
And you can see this from the actual data – extract here on USA Stock Market returns covering nearly 100 years (Source: Barclays Equity Gilt Study 2019)

As you can see, with enough data we tend to have two high points either side of the ‘average’ … and that makes perfect intuitive sense.
After all, over time, markets tend to be either bullishly running ahead of their long-term trend (as they have been for the past 10 years) or, in bear markets, falling behind it.
I explain the issue a bit more graphically, in this short video.
Stock market prices are driven by human herd behaviour, and as we’ve now been reminded recently, yet again, we humans can be a bit moody when it comes to investing.

So, it makes no sense to use a (normal distribution) model (a model that requires meaningful averages) to predict the risk of big moves or crashes in markets.
That’s just a fact.
And here’s more evidence from some academic experts who were so keen to get this point across that they wrote a whole paper to assess (or should I say, ‘pick apart’) Mr Viniar’s statement on Standard Deviations.
Just how unlikely is that?

In 2008, these academics* produced a serious but funny paper which exposed the fact that Mr Viniar – along with most other investment bankers – were using the wrong risk model!
*(Kevin Dowd, John Cotter, Chris Humphrey and Margaret Woods) from Nottingham University Business School (Centre for risk and insurance studies)
Amusingly, they called their paper: ‘How unlucky is 25-Sigma?’ and what they exposed, on the unlikeliness of Mr Viniar’s description of events, is truly breath-taking.
Here’s how they describe the chances of ‘big events’ in this ‘normal distribution’ model.
Remember, this is the model which many, in the finance industry claim allows them to measure risk by ‘deviations’ from the (theoretical) average return.
(Sigma, by the way, is just shorthand for 1 standard deviation)
- A 5-sigma event is equal to an expected occurrence of less than just one day in the entire period since the end of the last Ice Age.
- An 8-sigma event is equal to an expected occurrence of just once in a period, which is considerably longer than the time elapsed since Big Bang, and
- A 20-sigma event is equal to an expected occurrence of one day in a number of years equal to 10 times the likely number of particles in the universe.
Now, quite clearly, these are impossibly small chances!
But wait… we’re not yet at Mr Viniar’s 25-sigma assessment of what happened in 2008.
According to these academics, we’d need to take that 20-sigma event chance and divide it by 10 … not once but … 50 times in succession.
These probabilities (or chances if you prefer plain English) are just too small to imagine.
And that, ladies and gentlemen, is why (because they used a bad model of risk) investment bankers used to think it was okay to ignore these big risks!
Their model told them that the chances of their risk-taking going wrong were less than the chance of hell freezing over.
So, they carried on taking big risks.
Simple right?
Yes, very simple!
However, you might notice I’ve missed something in this story.
So far, we’ve only given you a sense of the infinitesimally small chance of one 25-sigma event occurring.
Think how unlucky you’d need to be for a 25-sigma event to happen… several days in a row!
Well, that’s what Mr Viniar suggested had happened.
The Queen finds the answer
The Nottingham Business School paper was (and still is) a great piece of ridicule.
However, it’s incredibly sad that this wrongly held belief was allowed to inflict so much damage to the world economy.
The Queen was, in her own way I think, angry at the economics profession, after the financial crisis and demanded an explanation,
‘Why did no one see this coming?’
She didn’t get a good explanation at the time but our Queen is nothing if not persistent. And, at the second time of asking – several years later – she got an explanation from the Bank of England which, in even simpler language, described what I’ve outlined above.
Now you might find it incredible that it took so long for (some people in) the financial profession to wake up to this flawed thinking?
Well, yes, but when someone (an Economist or anyone else) is challenged on their flawed theories, like a lot of people who are ‘wedded’ to ideas, they take a long time to back down.
Accepting you’re wrong is not easy, and it’s especially difficult if your living depends on being the ‘expert’ – academic, or otherwise.
That’s not new – it’s just human nature.

What can you conclude from this?
Well, surely it’s this.
That the world’s most hideously highly paid bankers
had absolutely no idea what risks they were taking
with our money and the world economy
before the global financial crisis.
And that’s a very scary thought… but here’s a scarier one.
What if your investment adviser still uses that broken model of risk to advise you on the risks in your portfolio?
How confident should you be in his/her confidence about risk probabilities?
If your adviser tells you that Stockmarket crashes are ‘outliers’ or that such things only happen ‘once in a generation’… or they talk to you about ‘Standard deviations’… you need to start asking some difficult questions and fast – because they’re probably using the same risk model as Mr Viniar!
And I assume that you do NOT want to be on the wrong side of that model when it goes wrong again, which it will – that’s one thing we know for sure.
Now, if you’d like some ideas on how to test your investment adviser take a look here.
I apologise if this Insight reaches you after the event. I’ve actually been writing on these issues for a few years now – and continue to do what I can to share the real truths about money – on matters of investments, pensions and financial planning more generally.
Get my Newsletter for more (occasional) ideas
Or follow along on Twitter for more frequent thoughts!
And take very good care of your wealth and your health out there.
Thanks for dropping in
Paul
For more ideas to achieve more in your life and make more of your money, sign up to my newsletter
As a thank you, I’ll send you my ‘5 Steps for planning your Financial Freedom’ and the first chapter of my book, ‘Who misleads you about money?’ Also, for more frequent ideas – and more interaction – you can join my Facebook group here
Share your comments here
You can comment as a guest (just tick that box) or log in with your social media or DISQUS account.
Discuss this article